
 Lietuviškai
 Deutsch
 Français
 Русский
 Español
 Polski
 Italiano
 Українська
 Čeština
 Português
 日本語
日本語 Latviešu valoda
 Eesti
Eesti Magyar
 Bahasa Indonesia
 Türkçe
 हिन्दी
 Ελληνικά
 العربية
 ไทย
ไทย Tiếng Việt
 Română
 Bahasa Melayu
 বাংলা
বাংলা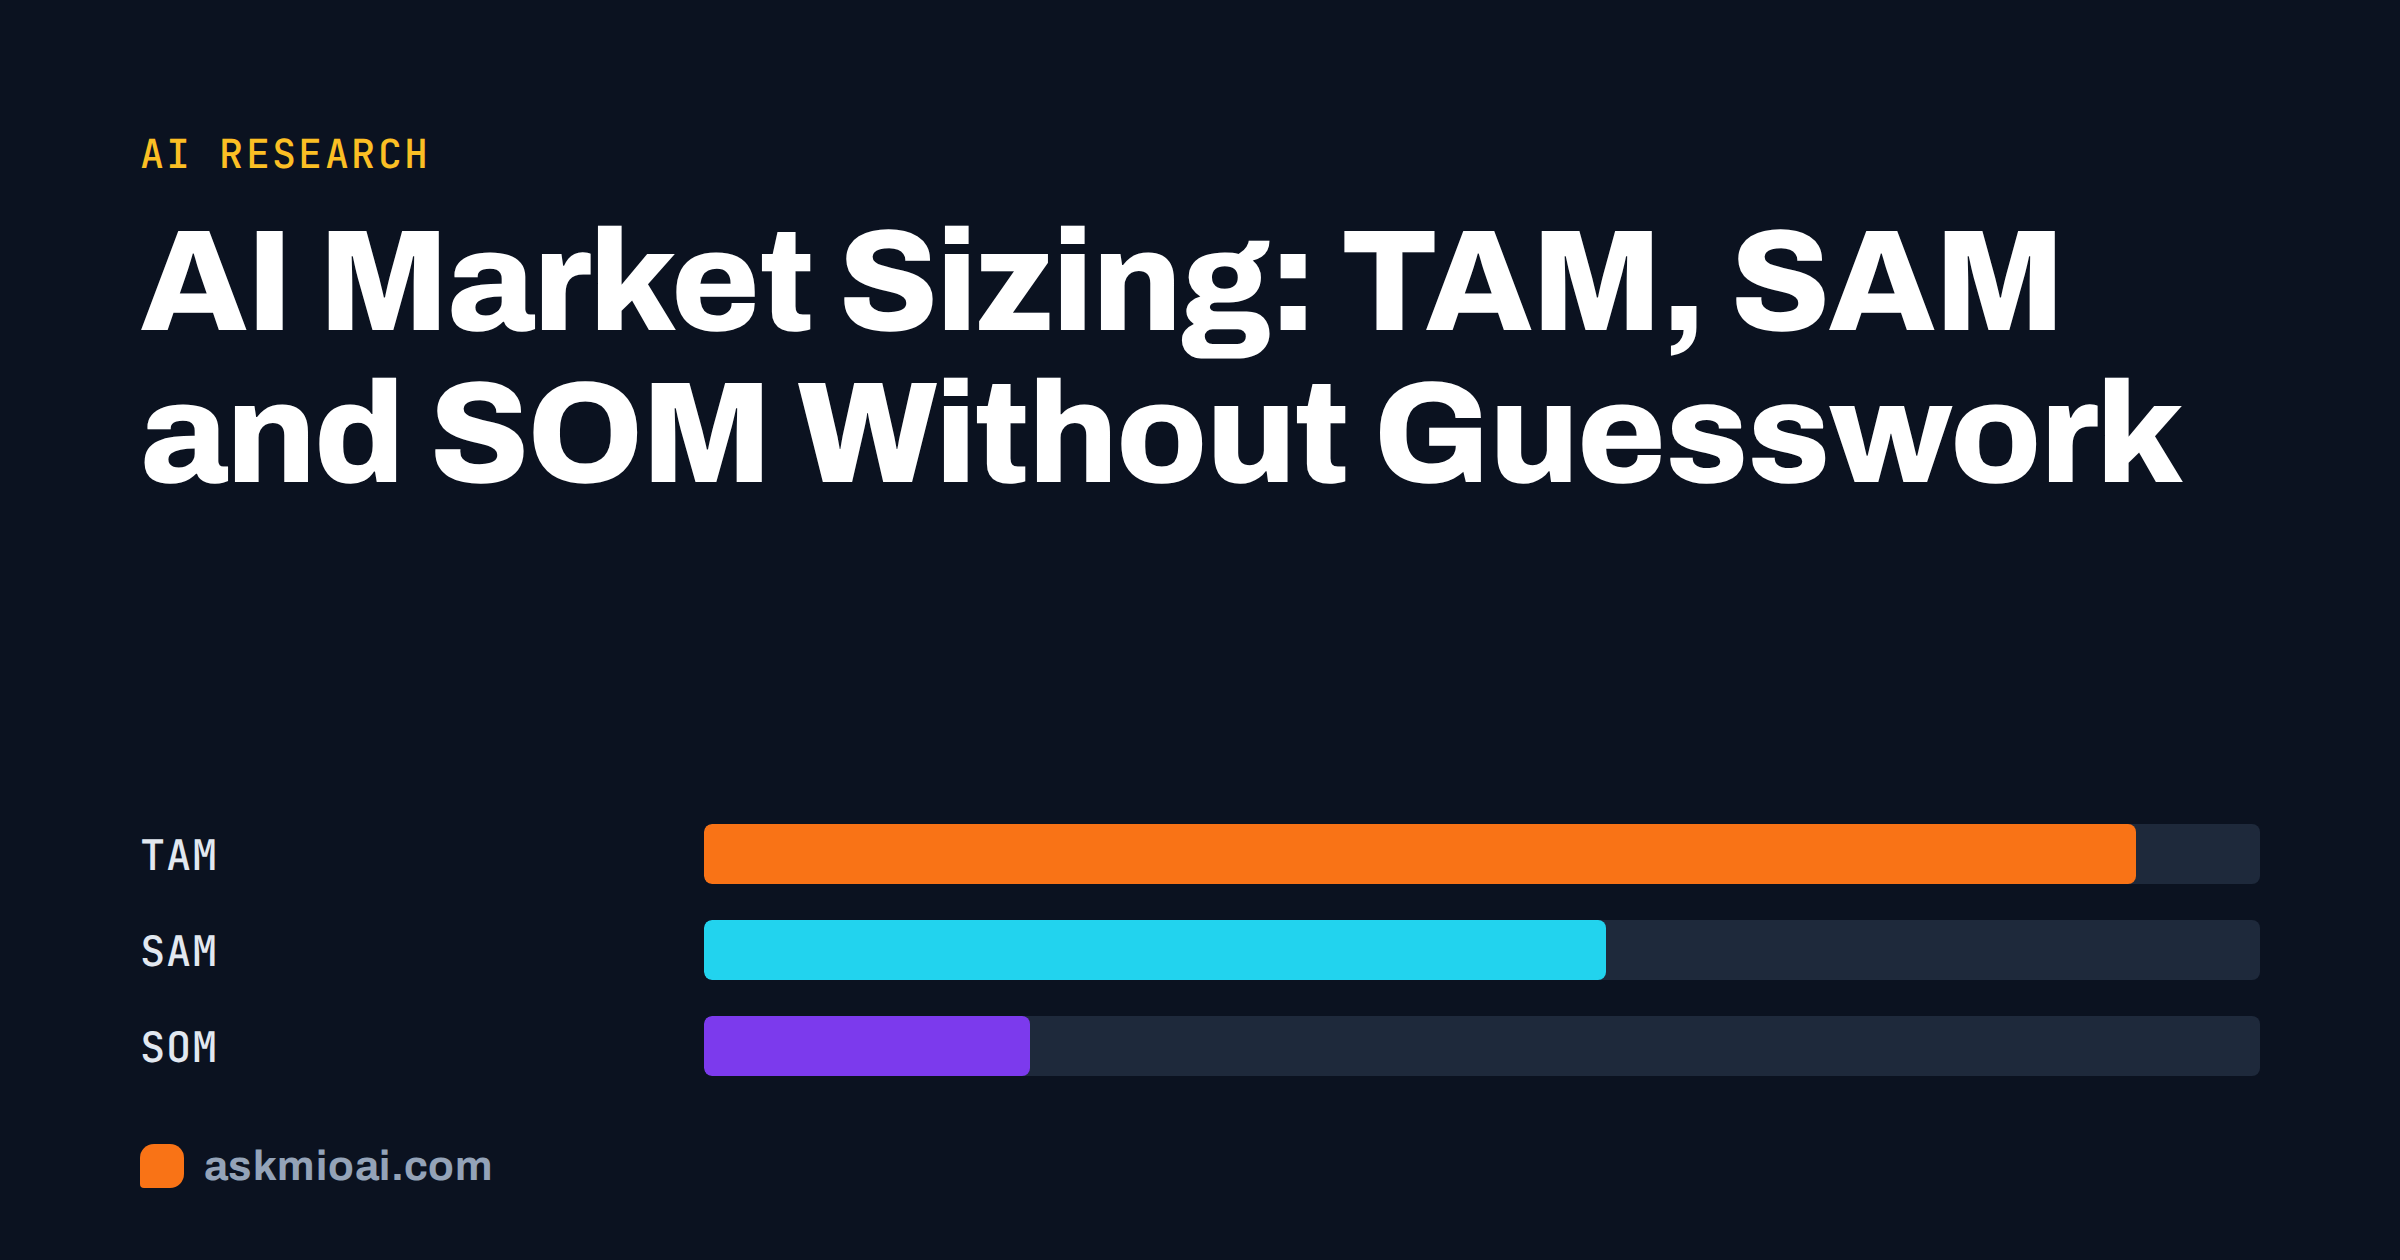
AI market sizing can turn an afternoon of searching, spreadsheets and guesswork into a structured estimate you can actually defend: a total addressable market, a serviceable share and a realistic first target, each with its sources and assumptions written down. The assistant is fast at finding data, building the calculation and spotting holes in your logic. It is also perfectly capable of producing an impressive number out of thin air, which is why the method matters more than the tool.
This guide shows how to do AI market sizing properly: the difference between TAM, SAM and SOM, top-down and bottom-up methods, prompts that keep the AI honest, how to check the result and how to present it to investors or your own team.
TAM, SAM and SOM in plain words
Market sizing usually works with three nested numbers.
- TAM, total addressable market: the total yearly revenue if every possible customer for this kind of product bought it. It shows the ceiling.
- SAM, serviceable available market: the part of TAM you can actually serve with your product, price, language, channels and geography.
- SOM, serviceable obtainable market: the share of SAM you can realistically win in a defined period, usually three to five years, given competition and your resources.
For an online booking tool for physiotherapy clinics, the TAM might be all clinics in Europe that could pay for scheduling software. The SAM might be small clinics in the countries and languages you support. The SOM is the number of those clinics you can sign up in three years with your sales capacity. The total addressable market article gives the standard definitions.
Why the bottom number matters most
Founders love a large TAM, but experienced investors usually look hardest at the SOM and the reasoning behind it. A small, well-argued SOM is more convincing than a huge TAM copied from a market report headline.
Top-down vs bottom-up market sizing
There are two basic methods, and a good estimate uses both.
Top-down
Start from a large published figure, such as total spending in a category or the number of businesses in a sector, and narrow it down with percentages. It is quick and easy to source, but each percentage is an assumption, and small changes multiply into large differences.
Bottom-up
Start from the unit: how many potential customers exist, how many you can reach, what share might buy, and what each pays per year. Multiply. It is slower and needs more thought, but every step is visible and testable, and it connects directly to your sales plan.
Triangulate
Do both and compare. If the top-down SAM is ten times the bottom-up SAM, one of your assumptions is wrong, and finding which one is the most valuable part of the exercise.
A step-by-step AI market sizing workflow
Step 1: define the market precisely
Vague definitions produce meaningless numbers. Write one sentence that states the customer, the problem, the geography and the price point: “Independent physiotherapy clinics with one to ten practitioners in Germany, Austria and Poland that would pay a monthly subscription of around €40–80 for online booking and reminders.”
Step 2: ask the AI to plan the calculation, not give the answer
“I want to estimate TAM, SAM and SOM for the market defined below. Do not give me a number yet. First, propose a bottom-up calculation and a top-down calculation: list each input variable, explain why it matters, and suggest what kind of source could provide it. Mark which inputs will be assumptions rather than data.”
This gives you a model you understand before any figure appears.
Step 3: find data for each input
Now research each variable separately. With web search and cited sources, an assistant can find official statistics, industry association figures, public company reports and pricing pages much faster than manual searching. Good starting points include national statistics offices and Eurostat’s database for business counts by sector and country. Ask for the source link and the year of every figure, and open the important ones yourself. Our guide on researching with AI and cited sources covers how to check them.
Step 4: build the calculation in a spreadsheet
Keep every input in its own cell with its source next to it, so anyone can change an assumption and see the effect. Ask the assistant to build the structure, or use a ready-made spreadsheet generator; see our AI spreadsheet generator guide.
Step 5: test the assumptions
Ask the AI to argue against the model: “Act as a sceptical investor. For each assumption in this market model, explain why it might be too optimistic, and suggest a more conservative value with a reason.” Then build a low, base and high scenario.
Step 6: sanity-check the result
Compare the SOM with real-world reference points: the revenue of a known competitor, the number of customers a similar company reached in its first years, or the sales capacity your plan actually funds. If your third-year SOM implies signing more customers than your team could possibly talk to, the model is wrong, not the team.
A worked example, in short
Here is how a bottom-up estimate for the clinic booking tool might be structured. The figures below are placeholders to show the method, not real market data.
- Number of physiotherapy practices in the three countries: from official business statistics, for example N.
- Share with one to ten practitioners: from the same statistics or an association report, for example 85%.
- Share not locked into a practice management suite that already includes booking: an assumption, tested with a small survey or sales calls, for example 40%.
- Average yearly price: from your own pricing, for example €720.
- SAM = N × 85% × 40% × €720.
- SOM after three years: the share of SAM your sales and marketing plan can realistically win, for example 3–5%, justified by your channel and capacity.
Every line has either a source or a clearly labelled assumption. That is what makes the number defensible.
Market sizing methods compared
| Method | Speed | Data needed | Credibility | Main risk | Best for |
|---|---|---|---|---|---|
| Top-down from a market report | Very fast | One headline figure | Low on its own | Report defines the market differently from you | A first rough ceiling |
| Top-down from official statistics | Fast | Business counts, spending data | Medium | Stacked percentage assumptions | TAM and early SAM |
| Bottom-up unit model | Medium | Customer counts, prices, conversion | High | Optimistic adoption rates | SAM, SOM, investor decks |
| Competitor benchmarking | Medium | Public revenue, customer counts | Medium | Private companies publish little | Sanity-checking SOM |
| Fermi-style estimate | Very fast | Common-sense quantities | Low to medium | Wrong order of magnitude | Quick go or no-go decisions |
| Customer survey or interviews | Slow | Your own primary data | High for willingness to pay | Small or biased samples | Testing key assumptions |
A Fermi estimate is worth knowing: breaking an unknown quantity into factors you can guess roughly. It is a good first pass to see whether a market is in the thousands, millions or billions before you spend time on research.
Where AI market sizing goes wrong
- Invented figures. Ask a model for “the size of the European clinic software market” and it may produce a confident number with no real source. Never accept a figure without a link you have opened. Our article on AI hallucinations explains why this happens.
- Outdated data. Without web search, the assistant only knows what it learned before its cut-off date. Always ask for the year of each figure.
- Mismatched definitions. A market report’s “healthcare software” may include hospital systems worth far more than your niche. Check what each source actually counts.
- Currency and year mixing. Figures from different years and currencies combined without conversion. Ask the AI to normalise everything to one currency and year.
- Double counting. Counting the same customer in two segments, or counting practitioners when the buyer is the practice.
- Optimism dressed as analysis. “If we get just 1% of the market” is not a SOM. The obtainable share must come from your go-to-market plan.
Presenting your market size
For a pitch deck or business plan, keep it simple and transparent.
- One slide with three nested circles or bars for TAM, SAM and SOM, each with its value and a one-line definition.
- A footnote or appendix with sources and key assumptions.
- The bottom-up logic shown as a short chain of multiplications.
- Low, base and high scenarios if the uncertainty is large.
Market sizing usually sits inside a broader plan. Our guides to writing a business plan with AI and AI competitor research cover the neighbouring sections.
Doing AI market sizing with Ask Mio
Ask Mio’s Research mode, included from the Chat plan up, searches the web and cites its sources, so every figure comes with a link you can open. On the Coding and Business plans, which include the code execution sandbox, Mio can also run Python to calculate scenarios exactly. Mio can convert currencies using official ECB rates with the currency tool and produce the model as an .xlsx file with the Spreadsheet / table job. The Financial analyst or Deep researcher expert keeps the whole chat focused on numbers and sources, and a project keeps your market definition and assumptions in one place across sessions.
Where a specialist is better: paid industry databases and commissioned market research contain data that is not on the public web, and for a large funding round or an acquisition, investors may expect that level of evidence.
Prompts you can reuse
These short prompts cover the most common steps of AI market sizing. Use them in order, in the same chat or project, so the assistant keeps the market definition in view.
- Definition check: “Here is my market definition. Point out anything vague: customer type, size, geography, price or buying decision. Suggest a sharper version.”
- Source hunt: “Find the most recent official figure for the number of businesses in this sector in each of these countries. Give the source link, the year and the exact definition the source uses.”
- Consistency check: “Convert all figures in this table to euros for the same year, explain each conversion, and flag any figure whose definition does not match my market.”
- Scenario build: “Create low, base and high scenarios for SAM and SOM. Change only the three assumptions with the biggest effect, and explain each value.”
- Investor questions: “List the ten questions an investor is most likely to ask about this market model, and which ones my current sources cannot answer.”
Frequently Asked Questions
Can AI tell me how big my market is?
It can help you build a credible estimate, but it should not simply hand you a number. Ask it to design the calculation, then find sourced data for each input and check the sources yourself. A figure that appears without a link and a year is a guess, however precise it looks, and investors will usually ask where it came from.
What is the difference between TAM, SAM and SOM?
TAM is the total yearly revenue available if every possible customer bought this type of product. SAM is the part you can actually serve with your product, language, channels and geography. SOM is the share of SAM you can realistically win in a defined period, based on your competition, sales capacity and marketing plan. SOM is the number that matters most for planning.
Should I use top-down or bottom-up market sizing?
Use both. Top-down gives a quick ceiling from published figures, while bottom-up builds the estimate from customer counts, reach, conversion and price, so every step can be tested. If the two results are far apart, look for the assumption causing the gap. Investors generally trust a bottom-up model more because it connects to how you will actually sell.
Where can I find reliable data for market sizing?
Start with official statistics: national statistics offices and Eurostat publish counts of businesses by sector, size and country. Industry associations, public company reports and regulators are also useful. Competitor pricing pages help with price assumptions. Market research report headlines are a weak source unless you can see how they define the market.
How precise does a market size estimate need to be?
Precise enough to support a decision, and transparent enough to be challenged. For most early-stage decisions, getting the order of magnitude right with clear assumptions matters more than a figure to the last euro. Round your results, show low and high scenarios, and spend your effort on the assumptions that change the outcome the most.
The Bottom Line
AI market sizing is worth doing, as long as the assistant builds the method with you instead of handing you a number. Define the market precisely, model it both top-down and bottom-up, source every input, test every assumption and present the result with its logic visible. A modest SOM you can defend beats a giant TAM you cannot. To run this workflow with cited web research and spreadsheet output, see the plans on the Ask Mio pricing page.